Nolla Visual Medicine Benchmark
| Model or physician group | Image only | Simulated interviews |
|---|---|---|
| Gemini 4 Argon | 46.5% | 83.2% |
| Claude Fable 5.2 | 43.1% | 86.4% |
| Gemini 3.8 Flash | 40.4% | 78.4% |
| Claude Opus 5.5 | 39.1% | 77.6% |
| GPT-6 Astra | 35.5% | 80.0% |
| Board-certified physicians | 34.1% | 78.8% |
| Gemini 4 Argon | 46.5% |
|---|---|
| Claude Fable 5.2 | 43.1% |
| Gemini 3.8 Flash | 40.4% |
| Claude Opus 5.5 | 39.1% |
| GPT-6 Astra | 35.5% |
| Board-certified physicians | 34.1% |
| Gemini 4 Argon | 83.2% |
|---|---|
| Claude Fable 5.2 | 86.4% |
| Gemini 3.8 Flash | 78.4% |
| Claude Opus 5.5 | 77.6% |
| GPT-6 Astra | 80.0% |
| Board-certified physicians | 78.8% |
Top-1 diagnostic concordance
When you see a doctor, they don’t just ask you questions. They look at you. The pattern of a rash, the color of an eye, or the location of swelling can change what they ask next and what they think might be wrong.
What they see helps guide the conversation. What they learn through conversation helps them interpret what they see.
We built the Nolla Visual Medicine Benchmark to evaluate that relationship: how well AI models interpret clinical images, gather information through conversation, and bring the two together to reach a diagnosis.
We’ve been using this benchmark internally for the past year to evaluate the models we develop for patient care. Now we’re sharing the results and a registered observational study comparing frontier models with physicians acting across specialties.
Tasks
This benchmark evaluates two related capabilities: a differential diagnosis from a single image, and a simulated multi-turn patient encounter with messages and images.
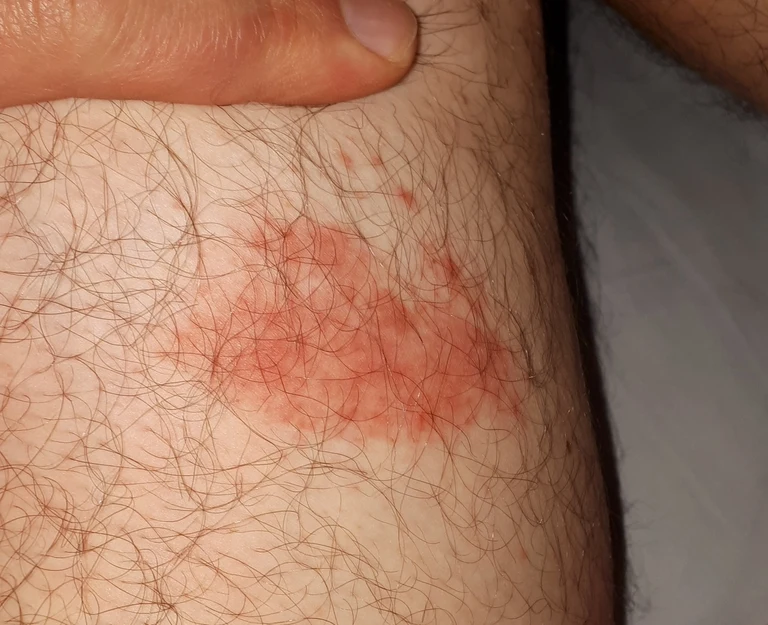
In the image-only task, a model or physician sees a single clinical photograph and writes a ranked list of possible diagnoses. There is no patient history and no opportunity to ask questions. This isolates what can be inferred from the visible finding.
In the interview task, a model or physician starts with a photograph and an initial message from a simulated patient, then asks follow-up questions over the course of the conversation. The encounter ends with a ranked differential diagnosis and a structured clinical note. This tests how participants gather and use information over a conversation.
Composition
The benchmark spans eleven medical specialties. Dermatology accounts for roughly 45% of the image cases, alongside pediatrics, emergency medicine, geriatrics, orthopedics, internal medicine, otolaryngology, ophthalmology, endocrinology, gynecology, and psychiatry.
Its image inventory contains 49 disease groups. These include skin cancers and precancers, eczema, acne, fungal infections, burns, joint disease, eye disorders, and visible manifestations of systemic disease. For example, acromegaly can change the shape of your hands and face. Cushing’s syndrome can cause distinctive purple stretch marks. Some cases concern a local finding; others require connecting an external sign with a condition affecting the rest of the body.
Physician Comparison
The study (registered as NCT07470463) enrolled 23 physicians across ten primary specialties, including 11 board-certified physicians, ten residents, and two fellows. Their median clinical experience was five years: seven among board-certified physicians and three among residents and fellows.
Physicians and models completed the same task formats, with responses assessed using the same blinded scoring pipeline.
This was a broad physician comparison. Only 16.5% of image reviews and 21.9% of interviews matched the physician’s own specialty. So the results describe a mixed group working largely outside its specialty, rather than establishing how models compare with specialists in every field.
In smaller unpublished trials, we observe board-certified physicians still reliably beating frontier models when operating within their specialty.
Results
The comparison below includes eight general-purpose models from Anthropic, Google, and OpenAI, alongside the physician cohort.
For the comparison below, a successful top-ranked diagnosis means a match to the reference diagnosis or an answer judged to imply clinically equivalent management. This is the study’s Level 3 diagnostic-concordance measure, assessed by an automated language-model judge.
Physicians averaged 30.2% on image-only cases and 56.0% on simulated interviews. The board-certified subgroup averaged 34.1% and 78.8%, respectively.
Gemini 4 Argon scored highest among the models shown on image-only cases at 46.5%, and reached 83.2% in simulated interviews. Claude Fable 5.2 led the interview task at 86.4%, with 43.1% on image-only cases.
The results show meaningful differences between systems under these evaluation conditions. They also show why the benchmark needs both tasks: identifying a finding from a photograph and reaching a diagnosis through an interview place different demands on a model.
The newer models were evaluated using the same prompts, simulated patient, and automated judge, with one scored output per case.